Overall Feature Stability Boxplot
Source:R/stability-1-dim-reduction.R
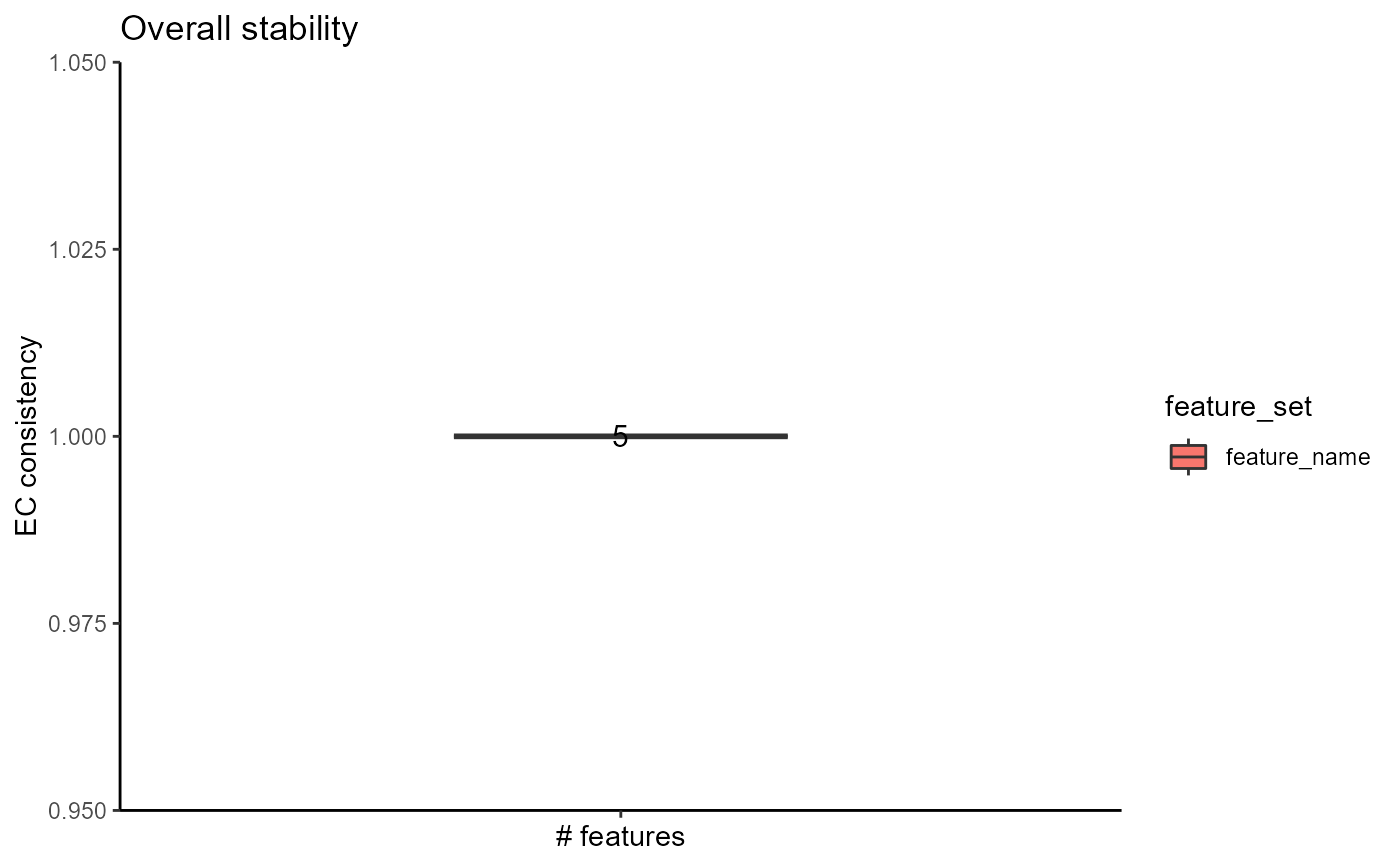
plot_feature_overall_stability_boxplot.RdDisplay EC consistency for each feature set and for each step.
Above each boxplot there is a number representing
the step (or the size of the subset). The ECC values are extracted for each
resolution value and summarized using the summary_function parameter.
plot_feature_overall_stability_boxplot(
  feature_object_list,
  summary_function = stats::median,
  text_size = 4,
  boxplot_width = 0.4,
  dodge_width = 0.7,
  return_df = FALSE
)
Arguments
- feature_object_list
An object or a concatenation of objects returned by the
assess_feature_stabilitymethod- summary_function
The function that will be used to summarize the ECC values. Defaults to
median.- text_size
The size of the labels above boxplots
- boxplot_width
Used for adjusting the width of the boxplots; the value will be passed to the
widthargument of theggplot2::geom_boxplotmethod.- dodge_width
Used for adjusting the horizontal position of the boxplot; the value will be passed to the
widthargument of theggplot2::position_dodgemethod.- return_df
If TRUE, the function will return the ECS values as a dataframe. Default is
FALSE.
Value
A ggplot2 object.
Examples
set.seed(2024)
# create an artificial expression matrix
expr_matrix <- matrix(
    c(runif(100 * 10), runif(100 * 10, min = 3, max = 4)),
    nrow = 200, byrow = TRUE
)
rownames(expr_matrix) <- as.character(1:200)
colnames(expr_matrix) <- paste("feature", 1:10)

feature_stability_result <- assess_feature_stability(
    data_matrix = t(expr_matrix),
    feature_set = colnames(expr_matrix),
    steps = 5,
    feature_type = "feature_name",
    resolution = c(0.1, 0.5, 1),
    n_repetitions = 10,
    umap_arguments = list(
        # the following parameters are used by the umap function
        # and are not mandatory
        n_neighbors = 3,
        approx_pow = TRUE,
        n_epochs = 0,
        init = "random",
        min_dist = 0.3
    ),
    clustering_algorithm = 1
)
plot_feature_overall_stability_boxplot(feature_stability_result)